

These maps are for planning and information purposes only. In polar regions, even the best laid plans change because of environmental conditions - so the actual traverses and science cruises will likely take routes that differ from the plans shown below.
-
Wider overview map, clear background
An overview map showing the location of the study area on the Antarctic continent, with surrounding continents. Transparent background. -
Wider overview map, white background
An overview map showing the location of the study area on the Antarctic continent, with surrounding continents. White background. -
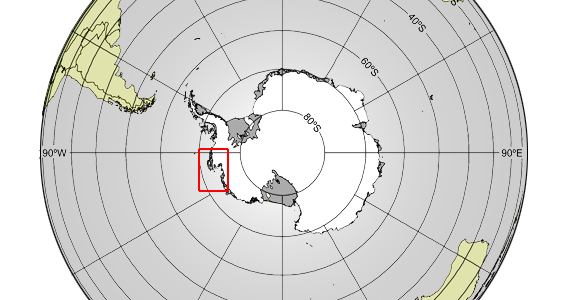
Overview map with bathymetry and graticule
Overview map of Antarctica showing the study area (red box). Bathymetry data are from IBCSO (Arndt et al., 2013), coastlines and grounding lines from MOA (Scambos et al., 2007). Graticule line intervals are 10° latitude, 30° longitude. Map by Povl Abrahamsen. -

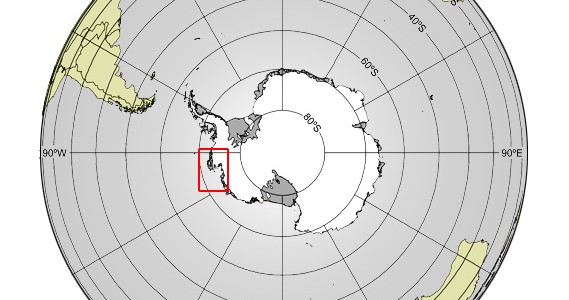
Overview map with bathymetry
Overview map of Antarctica showing the study area (red box). Bathymetry data are from IBCSO (Arndt et al., 2013), coastlines and grounding lines from MOA (Scambos et al., 2007). Map by Povl Abrahamsen. -
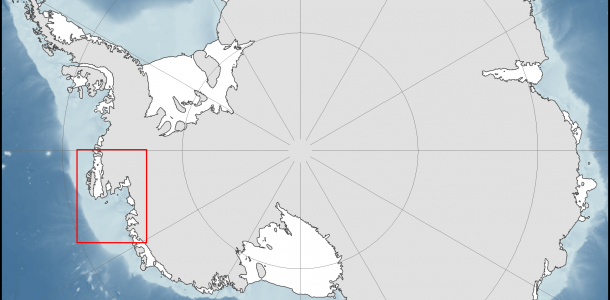
Overview map, continent with graticule
Overview map of Antarctica showing the study area (red box). Coastlines and grounding lines from MOA (Scambos et al., 2007). Graticule line intervals are 10° latitude, 30° longitude. Map by Povl Abrahamsen. -

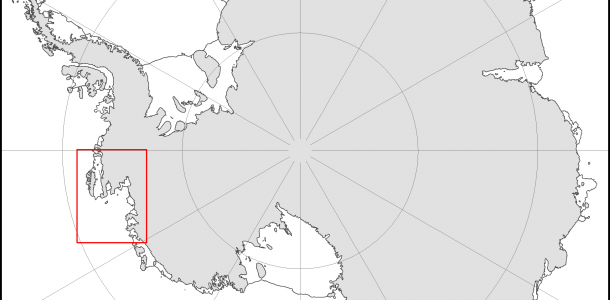
Overview map, continent only
Overview map of Antarctica showing the study area (red box). Coastlines and grounding lines from MOA (Scambos et al., 2007). Map by Povl Abrahamsen. -
Traverse route map 2013-2014
Planned route for the iSTAR traverse in 2013-2014. Map by Andy Smith. -
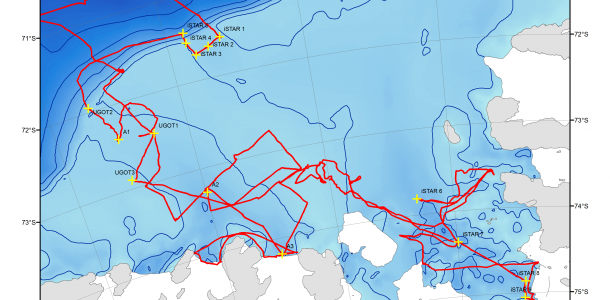
Araon cruise track and moorings 2012
Map of the Amundsen Sea showing the track of RV Araon in Feb. 2012 (cruise ANA-02C) and all moorings deployed on that cruise, including the nine iSTAR moorings. Moorings A1-3 are deployed by the Korea Polar Research Institute (KOPRI) and moorings UGOT1-3 by the University of Gothenburg. Bathymetry data from Nitsche et al., 2007 - data available from Frank Nietsche's website. Map by Povl Abrahamsen. -
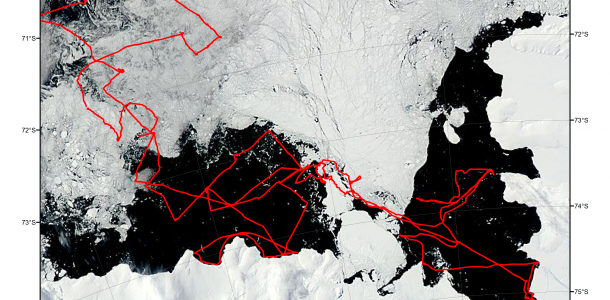
MODIS image with Araon cruise track 2012
MODIS Aqua satellite image from Feb. 15 2012, with the track of RV Araon from Feb 2012 (cruise ANA-02C) superimposed. This image clearly shows the sea ice and icebergs in the Amundsen Sea at the time, with a few clouds blurring the view towards the left. Image courtesy of NASA/GSFC, Rapid Response. Map by Povl Abrahamsen. -
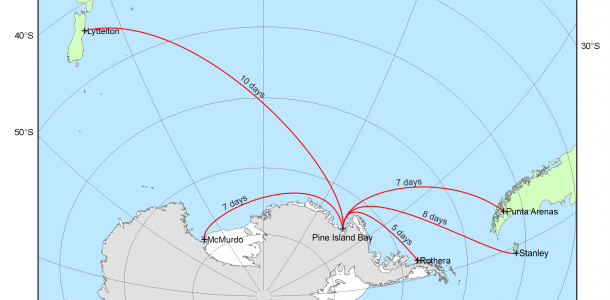
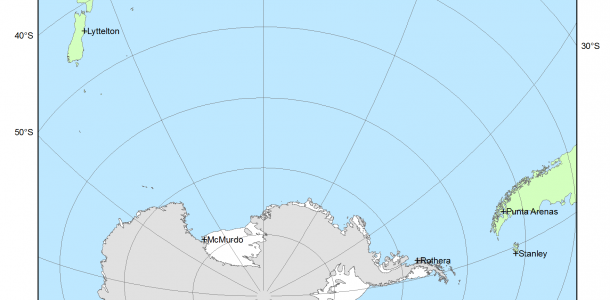
Transit Map with times
Map showing travel times by ship to the Amundsen Sea from "nearby" ports. Note that this assumes a fairly high average speed - perhaps possible in the open sea, but not through sea ice. So the actual transit times may be higher. Also, BAS ships normally do not travel at their maximum cruising speed, in order to conserve fuel. Map by Povl Abrahamsen. -
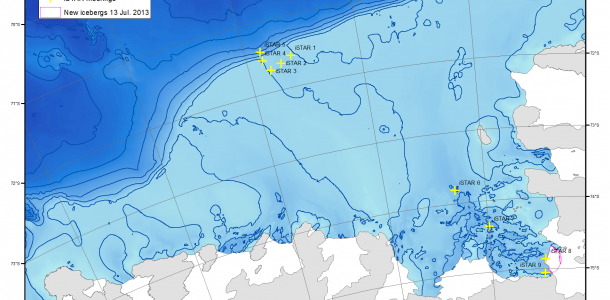
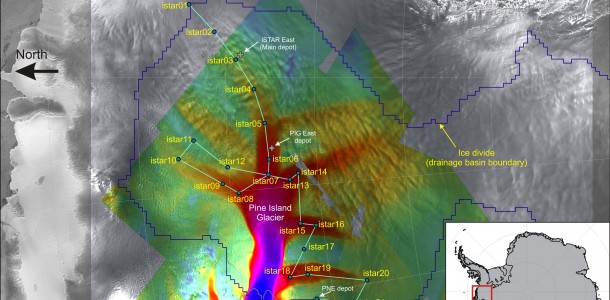
Moorings and new icebergs
Map of the Amundsen Sea showing the locations of the nine iSTAR moorings and the new iceberg formed from Pine Island Glacier in July 2013. -
Amundsen Sea Ports
Map showing ports "near" the Amundsen Sea. Map by Povl Abrahamsen.
